Volatility Analysis
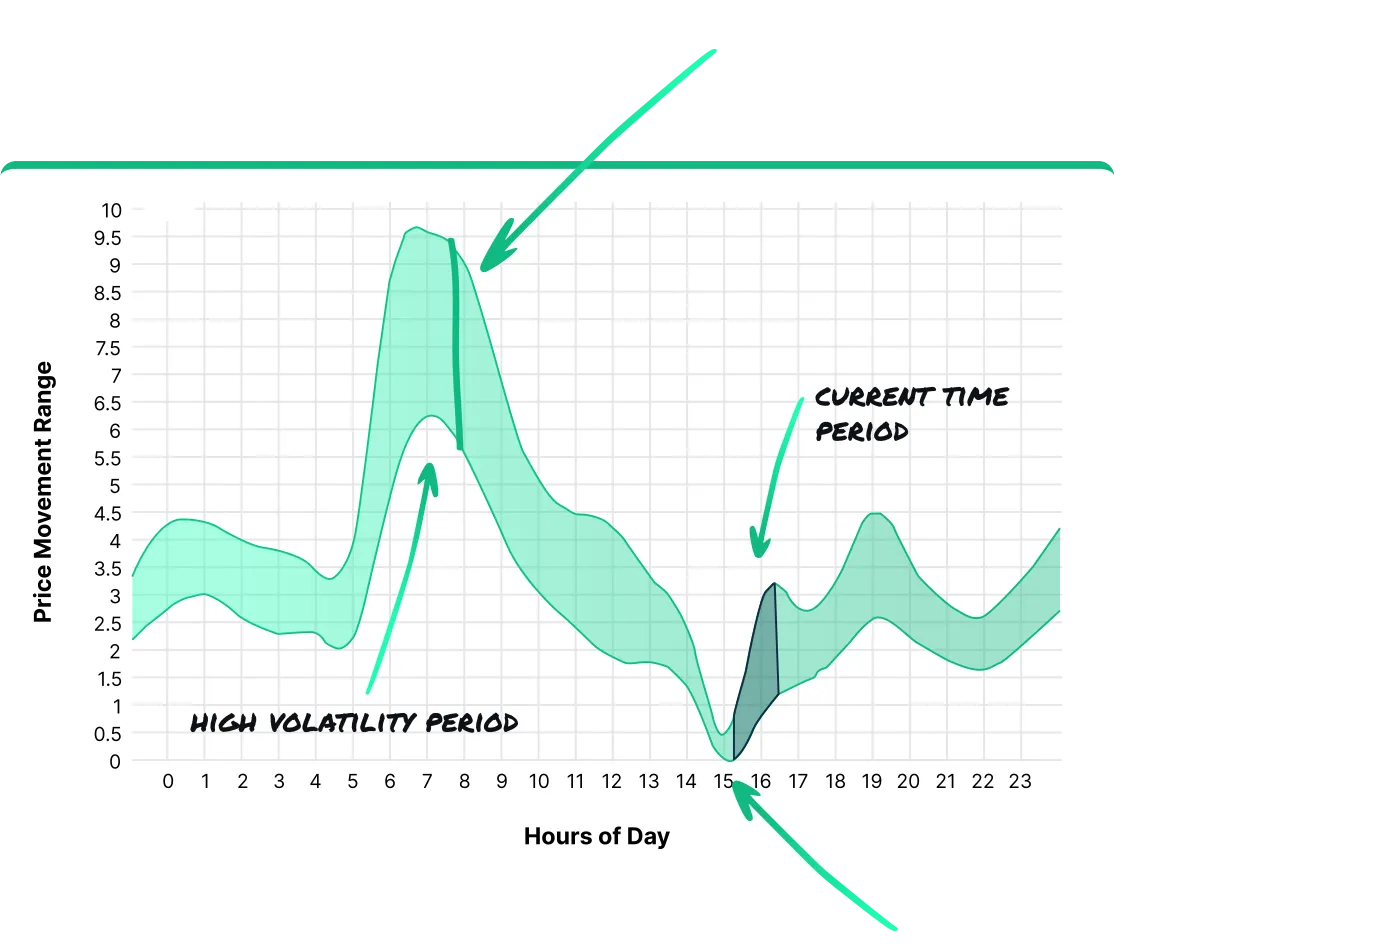
Volatility analysis involves assessing fluctuations in market prices over specific time frames, helping traders anticipate potential shifts. Autochartist’s real-time volatility analysis uses extensive historical data to measure expected market volatility, visually illustrating how price ranges vary by day, hour, and week. This analysis provides valuable insights into economic event volatility and other factors that drive price swings.
Real-Time Market Volatility Analysis (Day, Hour of Day, Day of Week)
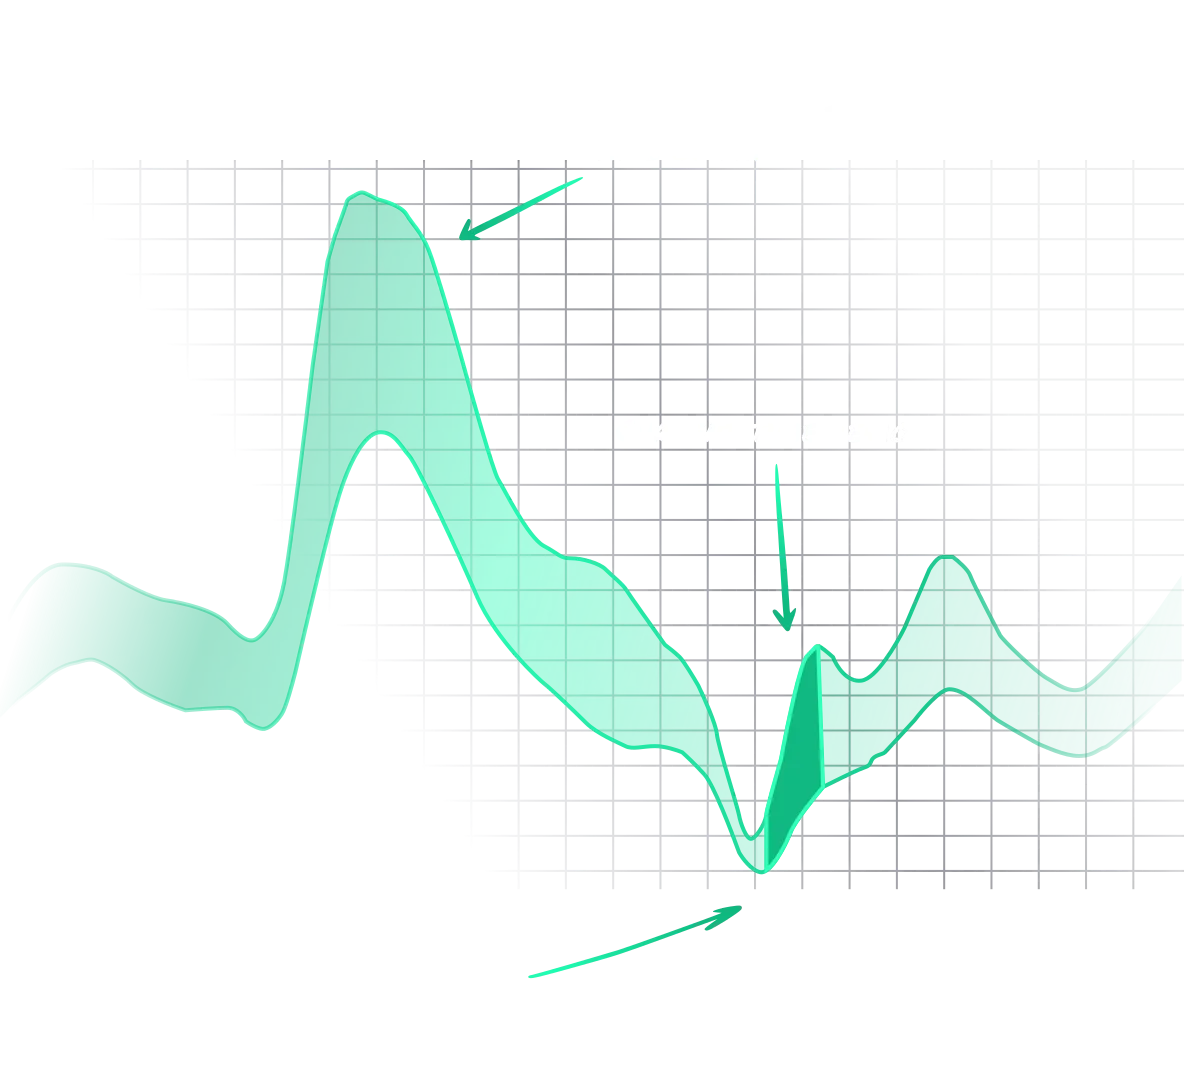
Autochartist uses significant historical data sets to measure expected market volatility and visually represent the market’s price range and how that changes based on the time of day or week.
Volatility Impact Warnings
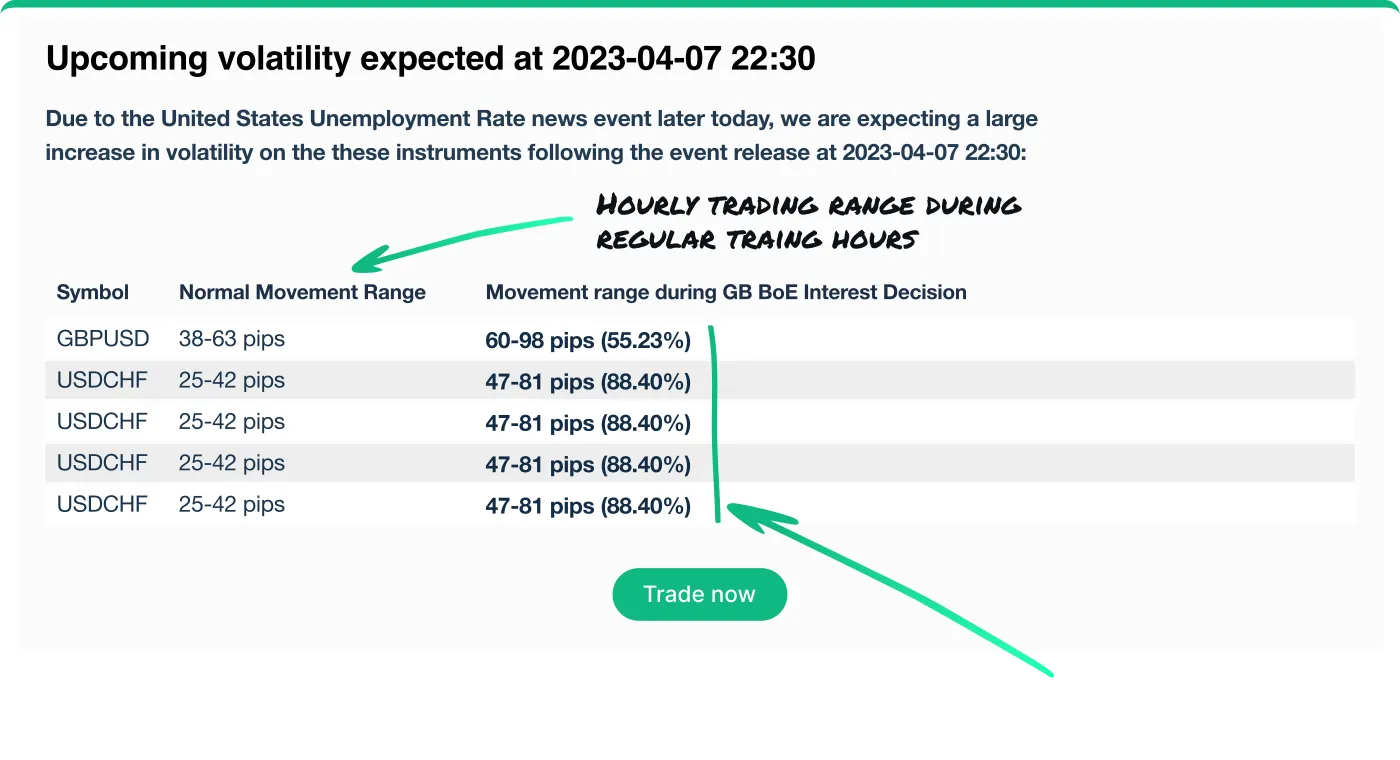
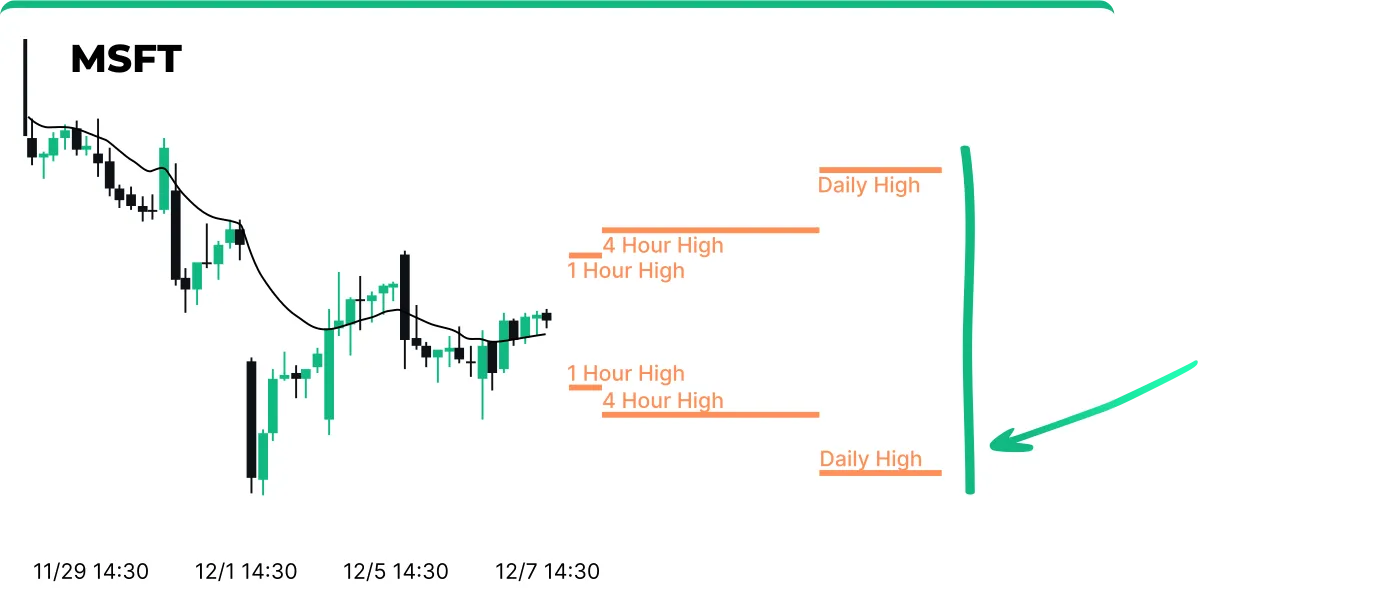
Autochartist delivers volatility impact warnings to highlight expected volatility spikes for specific financial instruments influenced by upcoming economic events. These alerts provide critical information on the potential magnitude of these changes, enabling traders to prepare for market reactions and track trading volatility spikes effectively.